Analysis graph
The Analysis Graph is a screen that overlays natal planetary positions with the movement of transits (or progressions/so
Prerequisite: This screen has no input fields for birth data. Please enter and save your birth data on the top page (input screen) first before opening this page. If no data is available, the message "Chart data not found. Please enter your birth data on the home page." will be displayed.
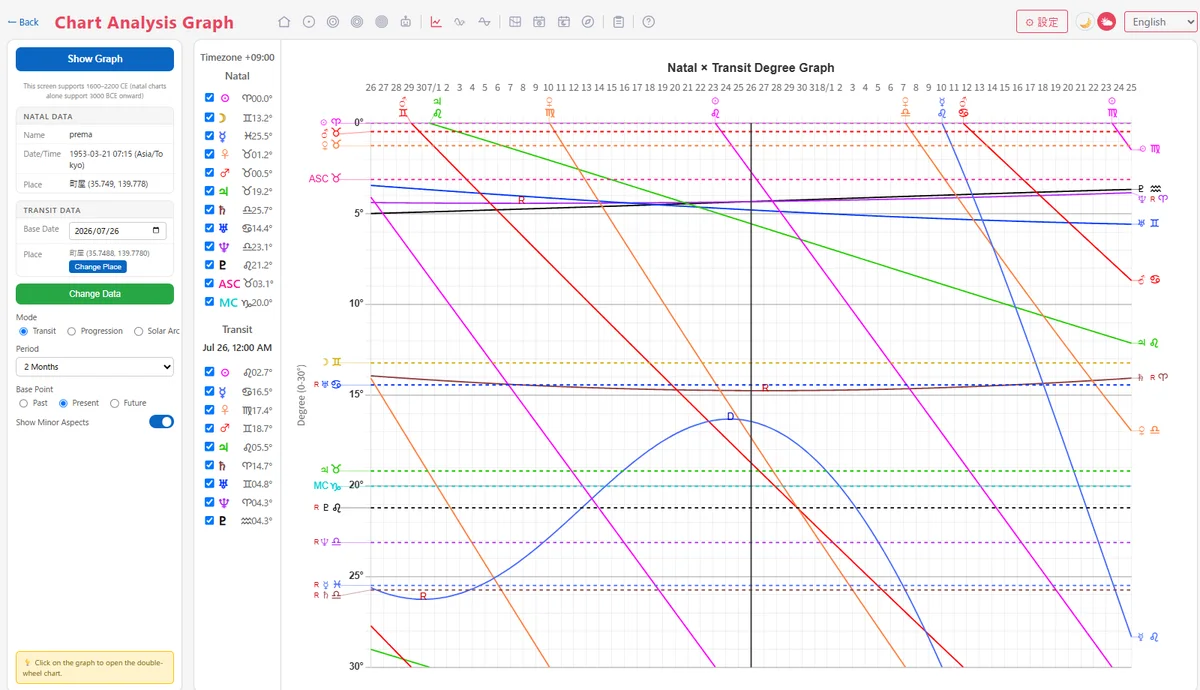
Full screen: settings panel on the left, legend in the center, graph on the right
1. Screen Layout
There are no tabs; only one type of "degree graph (0-30°)" is always displayed. The settings panel is on the left, the legend (a checklist of bodies with their current degrees) is in the center, and the graph is on the right.
2. Display Mode, Period, and Reference Point Position
| Item | Options | Default |
|---|---|---|
| Display Mode | Transit / Progression / Solar Arc | Transit |
| Reference Date | Date picker | Today |
| Period (for Transit) | 2 weeks / 2 months / 6 months / 1 year | 2 months |
| Period (for Progression / Solar Arc) | 5 years / 10 years / 30 years | 10 years |
| Reference Point Position | Past / Present / Future | Present |
| Show Minor Aspects | ON / OFF | ON |
"Reference Point Position" determines where the reference date is placed on the graph. "Past" places the reference date at the right edge of the graph, "Present" at the center, and "Future" at the left edge.
The graph is automatically recalculated the moment any of these settings is changed. The "Show Graph" button is used for the initial display or reload.
3. Setting the Transit Location
Click the "Change Location" button to open a modal, where you can specify the reference location for transits by place name search, clicking on the map, or entering latitude/longitude directly. The default is the same as the birthplace. Click "Confirm" to apply, or "Cancel" or × to discard the change.
4. How to Read the Graph
Meaning of the Axes
The horizontal axis (X-axis) represents time, and the vertical axis (Y-axis) represents degree-within-sign (0-30°, with 0° at the top and 30° at the bottom). The longer the period, the more the tick spacing is automatically adjusted.
Types of Lines
| Line | Meaning |
|---|---|
| Dashed line | Natal (birth-time) planetary position. Fixed value |
| Solid line | Movement of transit / progression / solar arc bodies |
At the moment a solid line crosses a sign boundary (0°⇔30°), the planet symbol and the symbol of the sign it is moving into are shown as a label. A red "R" mark appears where retrograde motion begins, and a blue "D" mark appears where it returns to direct motion. A vertical solid line is drawn at the position of the reference date.
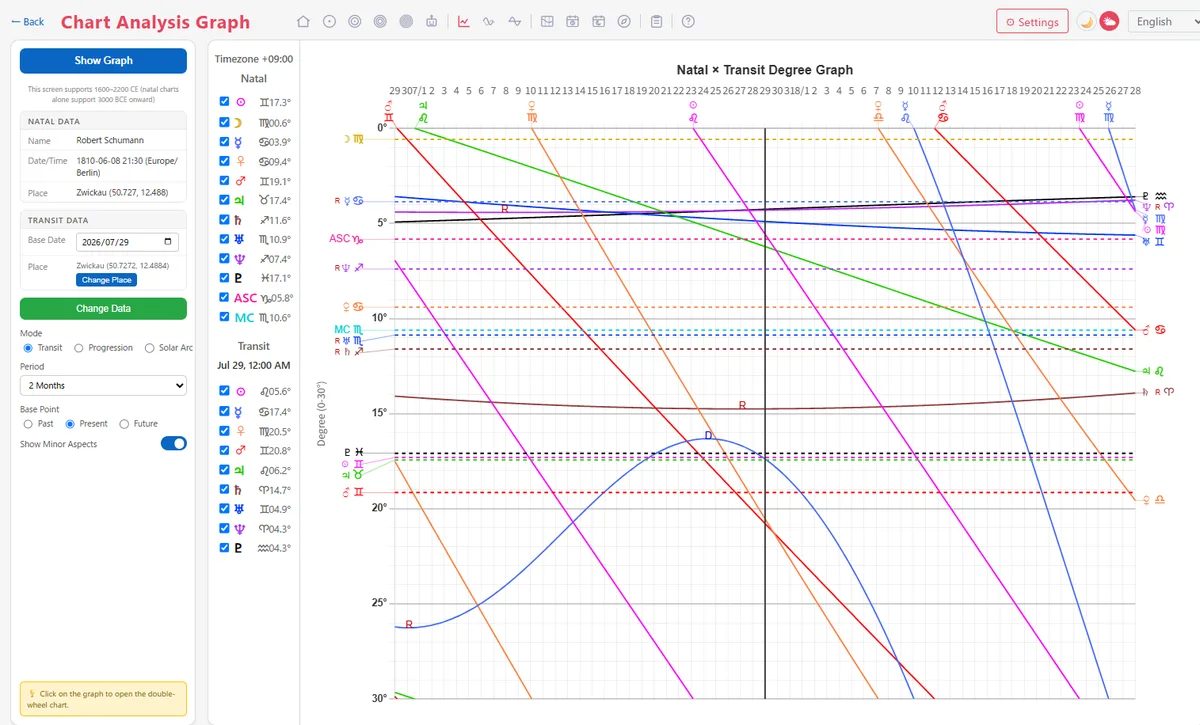
Dashed line = natal, solid line = transit. Sign boundary crossings and R/D marks are also shown
5. Legend and Toggling Displayed Bodies
The legend shows 12 natal-side items (Sun through Pluto, ASC・MC) and a checklist of the moving-side bodies (transit, etc.). The number of moving-side bodies changes automatically depending on the mode and period.
| Mode / Period | Bodies Covered |
|---|---|
| Transit, 2 weeks | 10 bodies: Sun through Pluto |
| Transit, 2 months | 9 bodies: Sun, Mercury through Pluto (excluding the Moon) |
| Transit, 6 months / 1 year | 6 bodies: Mars through Pluto (centered on outer planets) |
| Progression | 10 bodies: Sun through Pluto |
| Solar Arc | 10 bodies (Sun through Pluto) + ASC・MC |
Each item's checkbox toggles its visibility. The legend displays, in real time, the degree at the position where the mouse is hovering (or, when not hovering, at the reference date).
6. Aspect Display on Hover
When you hover the cursor over the graph, the aspects in effect at that moment are listed as combinations of planet symbols and aspect symbols (Conjunction, Sextile, Square, Trine, Opposition; if "Show Minor Aspects" is ON, Semisextile and Quincunx are also included). Aspects between two natal bodies are underlined.
7. Clicking to Open the Biwheel Chart
Clicking any position on the graph calculates the chart for that date/time and transit location, and opens the biwheel chart screen in a new tab.
8. Useful Specifications to Know
- Settings are automatically recalculated on every change: Changing the display mode, period, reference point position, or reference date updates the graph without needing to press any button.
- Time zone: The time zone specified on the settings screen is reflected in the graph's date axis and the legend's date/time display.
- Restoring the previous state: If you click to move to the biwheel chart and then come back, the graph settings you had displayed just before are restored as they were (this is not preserved if you close the browser tab).
- Changing birth data: This cannot be changed on this screen, so use the "Change Data" button to return to the top page and update it.